| |
| |
| API Call Tracing - PEfile, PyDbg and IDAPython |
| Author:
Amit Malik |
| |
| |
| |
|
|
|
| |
| |
| |
|
|
| |
| |
|
In this article, we will learn how to perfrom API Call Tracing of Binary file through PyDbg and IDAPython.
This is the part of our free "Reverse Engineering & Malware
Analysis Course".
You can visit our training page here and all the presentations of previous sessions here |
| |
|
|
| |
In my previous article, "Automation of Reversing" I have discussed on using PyDbg scripting environment. Here also we are going to use PyDbg extensively to trace or log the API calls from a binary file.
|
| |
|
|
|
API Call Tracing is the powerful technique. It can provide a high level functional overview about a executable file. In some cases we only need API call logs to understand the application behaviour. I often use it to automate my Malware analysis tasks.
In this article I will discuss some of my techniques.
Some of the tasks that we can accelerate using this technique are, |
- Unpacking of Packed Binary File
- Binary Behaviour profiling
- Finding out the interesting functions in the binary
|
| |
| Here, I will use PyDbg script to log the API calls and finally IDAPython script to automate some of manual analysis. |
| |
| |
|
| |
| Based on the above tasks we need following information from our script. |
- Return Address - From where the API is called?
- API Name - Which API is called?
|
It means we have to breakpoint on every API call and for that we need API name or API address. If we have API name then we can resolve its address and can breakpoint on that, In case of address we can directly breakpoint on that. But the question is how do we get the API names?
This can be solved by using PEfile. So we will first enumerate the executable import table and then we will resolve the addresses and put breakpoints using PyDbg.
But this approach has following limitations, |
- It will fail in the case of a DLL that will be loaded by binary at run time using LoadLibrary()
- If binary is packed then unpacking stub will create the import table at run time which we can't control.
|
Before solving this problem let's talk about the ways used by unpacker stub or custom loaders to build an import table at run time.
Generally they use LoadLibrary API to load the dll and GetProcAddress to get the address of the API. LoadLibrary and GetProcAddress APIs are exported by kernel32.dll which is loaded into every Windows process by default.
So if we set breakpoint on GetProcAddress then we can get API Name from stack. Then we can set breakpoint on the address of respective API call. Here I am ignoring the call for GetProcAddress with API Ordinal because it is not a common approach.
But there is also another method for building import table at run time which is typically used by malicious softwares.
In assembly it will look like this, |
| |
      	push dword ptr fs:[30h] ; PEB
        pop eax
        mov eax,[eax+0ch] ; LDR
        mov ecx,[eax+0ch] ; InLoadOrderModuleList
        mov edx,[ecx]
        push edx
        mov eax,[ecx+30h]
|
| |
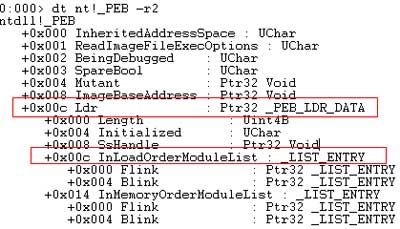
| Here is the screenshot of PEB structure of typical Windows Process (dumped in Windbg) |
| |
|
| |
In this method, custom loader first locate the kernel32.dll base address (2nd - after ntdll.dll in InLoadOrderModuleList link list] and then walk through the kernel32.dll export table to find out the LoadLibrary() address. After that custom loader will load all other dependent dlls and resolve the API Addresses using the following methods,
|
- GetProcAddress - similar to previous method
- Walking through the export table of each loaded dll.
|
| |
Here to capture the activity of #2 we have to use global hooks or SSDT hooks which is beyond the scope of this article.
Here are the step by step instructions for API Call Tracing,
|
- Walk through the binary import table and put breakpoint on every API
- Also put Breakpoint on GetProcAddress function.
- If Breakpoint hits and it is not GetProcAddress then extract 'Return Address' from stack and log it with API name
- If GetProcAddress hits then fetch API name and return address from stack and put breakpoint on 'Return Address'
- If 'Return Address' breakpoint hits then get value from EAX register and set breakpoint on it.
|
| |
| Based on this approach, we will write PyDbg script and log every API with 'Return Address' |
| |
'''
Author: Amit Malik
http://www.securityxploded.com
'''

import sys,struct
import pefile
from pydbg import *
from pydbg.defines import *

def log(str):
	global fpp
	print str
	fpp.write(str)
	fpp.write("\n")
	return

def addr_handler(dbg):
	global func_name
	ret_addr = dbg.context.Eax
	if ret_addr:
		dict[ret_addr] = func_name
		dbg.bp_set(ret_addr,handler=generic)
	return DBG_CONTINUE

def generic(dbg):
	global func_name
	eip = dbg.context.Eip
	esp = dbg.context.Esp
	paddr = dbg.read_process_memory(esp,4)
	addr = struct.unpack("L",paddr)[0]
	addr = int(addr)
	if addr < 70000000:
		log("RETURN ADDRESS: 0x%.8x\tCALL: %s" % (addr,dict[eip]))
	if dict[eip] == "KERNEL32!GetProcAddress" or dict[eip] == "GetProcAddress":
		try:
			esp = dbg.context.Esp
			addr = esp + 0x8
			size = 50
			pstring = dbg.read_process_memory(addr,4)
			pstring = struct.unpack("L",pstring)[0]
			pstring = int(pstring)
			if pstring > 500:
				data = dbg.read_process_memory(pstring,size)
				func_name = dbg.get_ascii_string(data)
			else:
				func_name = "Ordinal entry"
			paddr = dbg.read_process_memory(esp,4)
			addr = struct.unpack("L",paddr)[0]
			addr = int(addr)
			dbg.bp_set(addr,handler=addr_handler)
		except:
			pass
	return DBG_CONTINUE


def entryhandler(dbg):
	getaddr = dbg.func_resolve("kernel32.dll","GetProcAddress")
	dict[getaddr] = "kernel32!GetProcAddress"
	dbg.bp_set(getaddr,handler=generic)
	for entry in pe.DIRECTORY_ENTRY_IMPORT:
		DllName = entry.dll
		for imp in entry.imports:
			api = imp.name
			address = dbg.func_resolve(DllName,api)
			if address:
				try:
					Dllname = DllName.split(".")[0]
					dll_func = Dllname + "!" + api
					dict[address] = dll_func
					dbg.bp_set(address,handler=generic)
				except:
					pass

	return DBG_CONTINUE

def main():
	global pe, DllName, func_name,fpp
	global dict
	dict = {}
	file = sys.argv[1]
	fpp = open("calls_log.txt",'a')
	pe = pefile.PE(file)
	dbg = pydbg()
	dbg.load(file)
	entrypoint = pe.OPTIONAL_HEADER.ImageBase + pe.OPTIONAL_HEADER.AddressOfEntryPoint
	dbg.bp_set(entrypoint,handler=entryhandler)
	dbg.run()
	fpp.close()

if __name__ == '__main__':
	main()
|
| |
The output will look like, |
| |
    RETURN ADDRESS: 0x004030e8	CALL: kernel32!GetModuleHandleA
    RETURN ADDRESS: 0x004030f3	CALL: kernel32!GetCommandLineA
    RETURN ADDRESS: 0x00404587	CALL: kernel32!GetModuleHandleA
    RETURN ADDRESS: 0x00404594	CALL: kernel32!GetProcAddress
    RETURN ADDRESS: 0x004045aa	CALL: kernel32!GetProcAddress
    RETURN ADDRESS: 0x004045c0	CALL: kernel32!GetProcAddress
|
| |
| So let's apply the logic to some real world reverse engineering scenarios. |
| |
| |
| |
| Below is the log of a UPX packed binary. Look at it closely, can you say which function contains the OEP? |
| |
    RETURN ADDRESS: 0x00784b9e	CALL: GetProcAddress
    RETURN ADDRESS: 0x00784b9e	CALL: GetProcAddress
    RETURN ADDRESS: 0x00784b9e	CALL: GetProcAddress
    RETURN ADDRESS: 0x00784b9e	CALL: GetProcAddress
    RETURN ADDRESS: 0x00784b9e	CALL: GetProcAddress
    RETURN ADDRESS: 0x00784bc8	CALL: KERNEL32!VirtualProtect
    RETURN ADDRESS: 0x00784bdd	CALL: KERNEL32!VirtualProtect		--> 1
    RETURN ADDRESS: 0x0045ac09	CALL: GetSystemTimeAsFileTime	--> 2
    RETURN ADDRESS: 0x0045ac15	CALL: GetCurrentProcessId
    RETURN ADDRESS: 0x0045ac1d	CALL: GetCurrentThreadId
    RETURN ADDRESS: 0x0045ac25	CALL: GetTickCount
    RETURN ADDRESS: 0x0045ac31	CALL: QueryPerformanceCounter
    RETURN ADDRESS: 0x0044e99f	CALL: GetStartupInfoA
RETURN ADDRESS: 0x0044fd9c CALL: HeapCreate |
| |
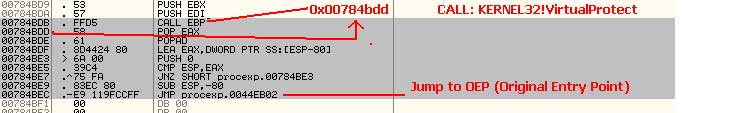
Here API at location 1 has 'Return Address' 0x00784bdd and API at location 2 has 'Return Address' 0x0045ac09. The difference between the addresses of both calls is huge which is an indication that the address 0x0045ac09 is in the function that contains OEP (original entry point).
This can be proved in the Ollydbg as shown in the below snapshot. |
| |
|
| |
| Most of the malwares these days have their own custom packers and I found this technique extemely useful in unpacking them. |
| |
| |
| |
| Look at the sample API Trace logs closely, Can you tell about the behaviour of this binary? |
| |
    RETURN ADDRESS: 0x004012ce	CALL: msvcrt!fopen       			 --> 1
    RETURN ADDRESS: 0x00401311	CALL: msvcrt!fseek
    RETURN ADDRESS: 0x0040131c	CALL: msvcrt!ftell
    RETURN ADDRESS: 0x0040133a	CALL: msvcrt!fseek
    RETURN ADDRESS: 0x00401346	CALL: msvcrt!malloc      			--> 2
    RETURN ADDRESS: 0x00401387	CALL: msvcrt!fread       			--> 3
    RETURN ADDRESS: 0x00401392	CALL: msvcrt!fclose
    RETURN ADDRESS: 0x004013b4	CALL: KERNEL32!OpenProcess  		--> 4
    RETURN ADDRESS: 0x004013ee	CALL: KERNEL32!VirtualAllocEx		--> 5
    RETURN ADDRESS: 0x00401425	CALL: KERNEL32!WriteProcessMemory   --> 6
    RETURN ADDRESS: 0x0040146b	CALL: KERNEL32!CreateRemoteThread   --> 7
    RETURN ADDRESS: 0x004014a4	CALL: msvcrt!exit
|
| |
| This is a clear indication of this binary reading a file and injecting code into another process. |
| |
| |
| |
| Here's the API Trace log of another binary, |
| |
    RETURN ADDRESS: 0x00443c29	CALL: inet_ntoa			--> point 1
    RETURN ADDRESS: 0x0044a6ee	CALL: KERNEL32!HeapAlloc
    RETURN ADDRESS: 0x00446866	CALL: KERNEL32!GetLocalTime
    RETURN ADDRESS: 0x0044a6ee	CALL: KERNEL32!HeapAlloc
    RETURN ADDRESS: 0x00443f79	CALL: socket			--> point 2
    RETURN ADDRESS: 0x00443fb5	CALL: setsockop
    RETURN ADDRESS: 0x00443fd0	CALL: setsockopt
    RETURN ADDRESS: 0x00444045	CALL: ntohl
    RETURN ADDRESS: 0x0044404f	CALL: ntohs
    RETURN ADDRESS: 0x00444063	CALL: bind			--> point 3
    RETURN ADDRESS: 0x0044412c	CALL: ntohl
    RETURN ADDRESS: 0x0044413c	CALL: ntohs
    RETURN ADDRESS: 0x0043adf6	CALL: WSAAsyncSelect
    RETURN ADDRESS: 0x0044416b	CALL: connect			-->  point 4
    RETURN ADDRESS: 0x00444176	CALL: WSAGetLastError

    RETURN ADDRESS: 0x00441979	CALL: USER32!DispatchMessageA
    RETURN ADDRESS: 0x00444ce0	CALL: KERNEL32!GetTickCount
    RETURN ADDRESS: 0x00444cfa	CALL: KERNEL32!QueryPerformanceCounter
    RETURN ADDRESS: 0x00444499	CALL: recv			--> point 5
    RETURN ADDRESS: 0x0044a8c6	CALL: KERNEL32!HeapFre
    RETURN ADDRESS: 0x0043adf6	CALL: WSAAsyncSelect
    RETURN ADDRESS: 0x004441f7	CALL: closesocket
    RETURN ADDRESS: 0x0044a8c6	CALL: KERNEL32!HeapFree
|
| |
| Marked points here reflects interesting functions used by this binary revealing network activity. |
| |
| |
| |
| |
| We can further use these Addresses from 'API Trace Log file' in IDA to identify functions and cross references.
Below is the simple IDAPython script that will read the above script log file and colour the calls in IDA database.
|
|
'''
Author: Amit Malik
http://www.securityxploded.com
'''
from idaapi import *
from idc import *
import sys


class logparse():
	def __init__(self,file_path):
		self.file_path = file_path
		self.fp	= open(self.file_path,'r')
		self.data = self.fp.readlines()

	def parser(self):
		dict = {}
		for line in self.data:
			line_slice = line.split()
			address = line_slice[2]
			name = line_slice[4]
			dict[address] = name

		for ea in dict.keys():
			print dict[ea]
			ea_c = PrevHead(ea)
			SetColor(ea_c,CIC_ITEM,0x8CE6F0)
		return

def main():
	file_path = AskFile(0,"*.*","Enter file name: ")
	logobj = logparse(file_path)
	logobj.parser()
	return

if __name__ == '__main__':
	main()
|
| |
| |
| |
| |
| In this article, you have learnt how to do 'API Call Tracing' using PyDbg/IDAPython scripts and perform useful tasks such as Unpacking, Binary Profiling, Discovering Interesting functions etc.
There are lot more useful applications of API Tracing and this article just serve as startup guide.
|
| |
| |
|
- Pydbg - http://code.google.com/p/paimei/
- OllyDbg - http://www.ollydbg.de/
- Windbg - http://msdn.microsoft.com/windbg
- IDAPython - http://code.google.com/p/idapython/
- Reference Guide - Reversing & Malware Analysis Training
|
| |
| |
|
|
|
| |
| |
| |
| |
| |
| |
| |