| |
| |
| Malware Memory Forensics |
| Author:
Monnappa |
| |
| |
| |
|
|
|
| |
| |
| |
|
|
| |
| |
|
Memory Forensics is the analysis of the memory image taken from the running computer.
In this article, we will learn how to use Memory Forensic Toolkits such as Volatility to analyze the memory artifacts with practical real life forensics scenario. |
| |
|
|
| |
This article is the part of our free "Reverse Engineering & Malware
Analysis Course". You can visit our training page here and all the presentations of previous sessions here |
| |
| |
|
|
|
Memory forensics can help in extracting forensics artifacts from a computer's memory like running process, network connections, loaded modules etc etc. It can also help in unpacking, rootkit detection and reverse engineering.
Below are the list of steps involved in memory forensics |
- Memory Acquistion - This step involves dumping the memory of the target machine. on the physical machine you can use tools like Win32dd/Win64dd, Memoryze, DumpIt, FastDump
on the virtual machine, acquiring the memory image is easy, you can do it by suspending the VM and grabbing the ".vmem" file.
- Memory Analysis - once a memory image is acquired, the next step is analyze the grabbed memory dump for forensic artifacts. tools like Volatility and Memoryze can be used to analyze the memory
|
| |
| |
| |
|
| Volatility is an advanced memory forensic framework written in python. It can be installed on multiple operating systems (Windows, Linux, Mac OS X), Installation details of volatility can be found here. |
| |
| |
|
        * using -h or --help option will display help options and list of a available plugins
        example: python vol.py -h

        * Use -f   and --profile to indicate the memory dump you are analyzing
        example: python vol.py -f mem.dmp --profile=WinXPSP3x86

        * To know the --profile  info use below command:
        example: python vol.py -f mem.dmp imageinfo
|
| |
| |
| |
| |
| In order to understand memory forensics and the steps involved. I have created a scenario, our analysis and flow will be based on the below scenario. |
| |
| |
|
| Your security device alerts, show malicious http connection to ip address 208.91.197.54 from a source ip 192.168.1.100 on 8th june 2012 at around 13:30hrs...you are asked to investigate and do memory forensics on that machine 192.168.1.100 |
| |
| |
|
| To start with, acquire the memory image from 192.168.1.100, using memory acquistion tools. for the sake of demo, the memory dump file is named as "infected.dmp". |
| |
| |
| |
| |
| Now that we have acquired "infected.dmp", lets start our analysis |
| |
|
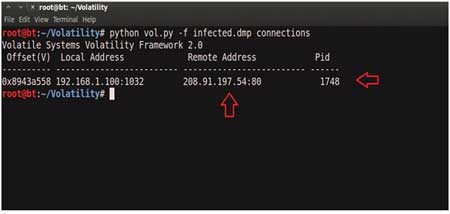
| We know from the security device alert that the host was making an http connection to 208.91.197.54. so lets look at the network connections.
Volatility's connections module, shows connection to the malicious ip made by pid 1748 |
| |
|
| |
| |
|
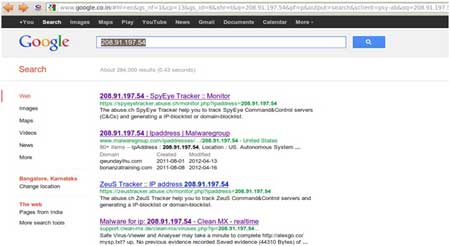
Google search shows this ip 208.91.197.54 to be associated with malware, probably "SpyEye", we need to confirm that yet.
|
| |
|
| |
| |
|
| Since the network connection to the ip 208.91.197.54 was made by pid 1748, we need to determine which process is associated with pid 1748. "psscan" shows pid 1748 belongs to explorer.exe, also two process created during same time reported by security device (i.e june 8th 2012) |
| |
|
| |
| |
|
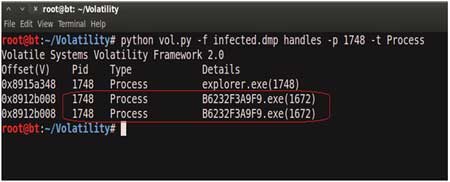
| Now that we know explorer.exe (which is an operating system process) was making connections to the malicious ip, there is a possibility that explorer.exe is infected.
Lets looks at the process handles of explorer.exe. The below screenshot shows Explorer.exe opens a handle to the B6232F3A9F9.exe, indicating explorer.exe might have created that process, which might also be malicious…Lets focus on explorer.exe for now
|
| |
|
| |
| |
|
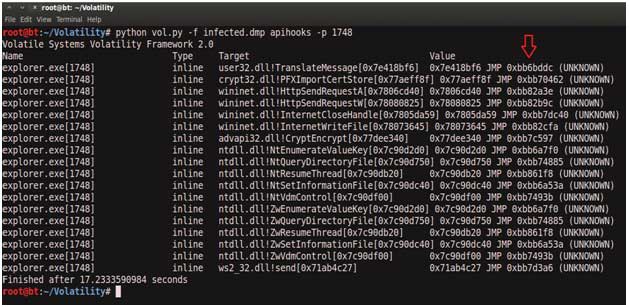
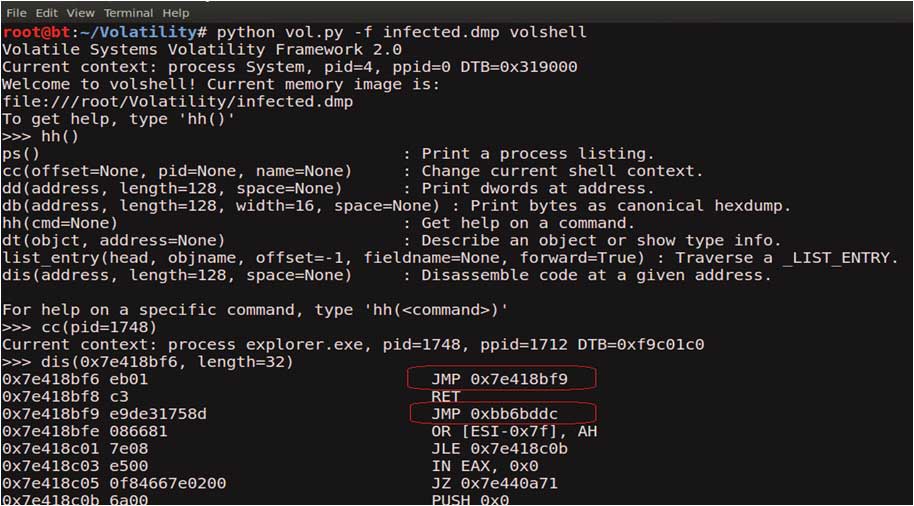
| APIhooks module show, inline API hooks in explorer.exe and jump to an unknown location |
| |
|
| |
| |
|
Disassembled hooked function (TranslateMessage), shows a short jump and then a long jump to malware location
|
| |
|
| |
| |
|
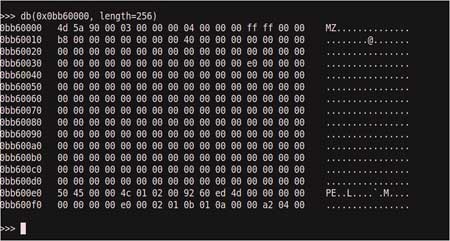
| Printing the bytes at the hooked location, show the presence of embedded executable in explorer.exe |
| |
|
| |
| |
|
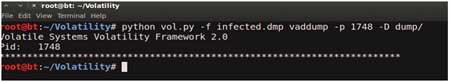
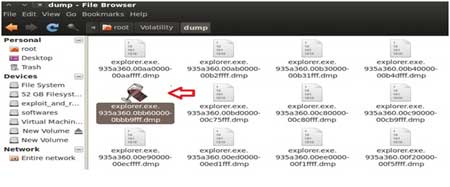
| VadDump tool dumps the embedded exe from explorer.exe |
| |
|
| |
|
| |
| |
|
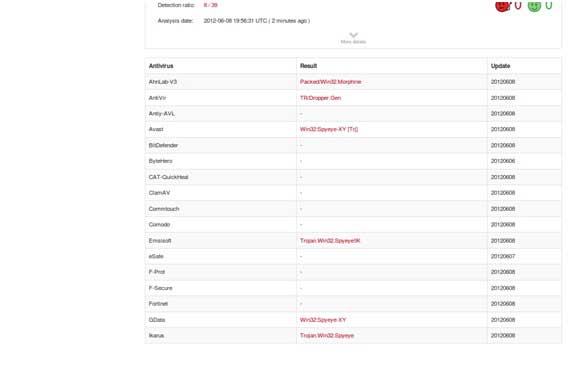
| Submission to VirusTotal, confirms the dumped executable as component of "SpyEye" |
| |
|
| |
| |
|
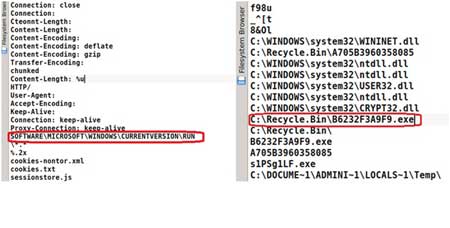
| Strings extracted from the dumped executable, show reference to interesting artifacts (executable and the registry key), it also shows the path to the suspicious executable B6232F3A9F9.exe. |
| |
|
| |
| |
|
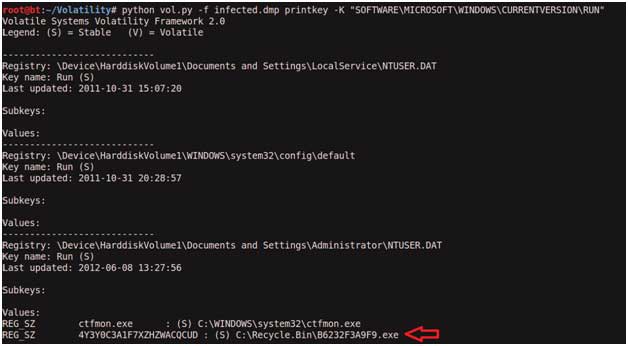
| Printing the registry key determined from the above step(step 10) shows that, malware creates registry key to survive the reboot |
| |
|
| |
| |
|
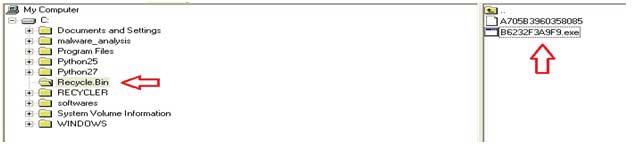
| Now that we know the path to the suspicious executable, lets find it on the infected machine. Finding malicious sample from infected host and virustotal submission confirms SpyEye infection. |
| |
|
| |
|
| |
| |
| |
| |
| Memory forensics is a powerful technique and with a tool like Volatility it is possible to find and extract the forensic artifacts from the memory which helps in incident response, malware analysis and reverse engineering. |
| |
| |
| |
|
- Reversing Training Session 6 – Malware Memory Forensics
- Volatility - An advanced memory forensics framework
- Volatility - Volatile memory analysis research
|
| |
| |
|
|
|
| |
| |
| |
| |
| |
| |
| |
| |